It’s easy to get whiplash from how fast the Internet changes.
Just think: Merely 8.2% of US households owned a computer in 1984. Now, over seven billion people across the world own a mobile device. In just three decades, we went from almost nobody owning a computer to nearly the entire world being connected via the internet. That’s mind-boggling.
With how quickly and often the internet changes, it’s more important than ever for bloggers, website managers, and digital marketers to keep up. Doing so gives you crucial context for your digital strategies and goals.
We want to help.
Below are more than 100 of the most important statistics and facts about the Internet. Use them to help guide your digital marketing efforts this year.
What We’ll Cover:
- General Internet Statistics and Facts
- Mobile Usage Statistics and Facts
- Blogging Statistics and Facts
- Ecommerce Statistics and Facts
- Web Hosting Statistics and Facts
- Social Media Statistics and Facts
- SEO Statistics and Facts
- Domains Statistics and Facts
General Internet Statistics and Facts
These numbers and takeaways are high-level overviews of the Internet and websites as a whole.
More people are using the Internet than ever before
- 5.18 billion people use the internet. That’s more than 65% of the entire world.
- China and India rank first and second respectively when it comes to number of users. There are 854 1.05 billion internet users in China and 692 million Internet users in India. China easily outpaces the competition in users.
- 311.3 million people in the United States use the internet. The US ranks just third-highest in Internet users by country.
When it comes to users, Asia wins big, and by a lot
- In fact, Asia dominates the global market making up 55% of all Internet users.
- North America makes up just 4.7% of all Internet users across the globe. Interesting considering Silicon Valley’s tech dominance on the world stage.
Here’s what the rest of the world looks like when it comes to Internet usage:
- 10.6% in Europe
- 17.6% in Africa
- 8.4% in Latin American and the Caribbean
- 3.4% in the Middle East
- 0.5% in Oceania and Australia
- Kuwait has a 99.6% internet penetration rate
- The global total Internet penetration rate is just 58.4%. This is a big jump from the year 2000 when global Internet penetration rates were just 5% on average!
Internet usage grows every day (but a lot of it comes from robots)
- The average user spends 6 hours and 37 minutes on the Internet each day. That amounts to 100+ days online per year!
- There are 1.5 billion websites on the Internet right now – and that number grows by the second.
- 47.4% of all online traffic comes from bots.
- The Internet sees 88.5 terabytes of data processed every single second.
- 347.3 billion emails are sent and received each day.
Mobile Usage Statistics and Facts
When it comes to Internet usage, mobile is king. That’s why it’s so important that digital marketers and website managers optimize for mobile. Below are a few numbers and stats you should keep in mind to help guide your decisions:
Smartphones are more popular than ever (and water is wet!)
- 6.7 billion people all over the world use smartphones. That number is anticipated to jump to 7.7 billion by the end of 2028.
- For comparison, 2.5 billion people used smartphones in 2016.
- Americans tend to use mobile devices more often than they watch TV.
- The average US adult spends 3 hours and 15 minutes on their smartphones every single day.
- People of all income and social strata use smartphones for their needs. According to a Pew study, “smartphone ownership exhibits greater variation [than cellphone usage] based on age, household income, and educational attainment.”
People use mobile devices to do the majority of their web browsing
- 55% of internet traffic comes from mobile devices.
- 49% of emails are opened on mobile devices.
- 63% of organic search traffic on Google comes from mobile devices.
Mobile users love to shop (and they like different ways to do it)
- Shopping is increasingly becoming omni-channel. 82% of smartphone users look up products they’re interested in on their phones before they make an in-store purchase.
- 67% of mobile users in Australia say they use mobile devices for “digital window shopping.” 77% of those users end up making impulse purchases. That’s a window that allows you to capitalize on your users window shopping experience.
- 2/3 of Internet users use mobile apps to shop
- 66% of all ecommerce shopping is done on mobile devices
Optimize your site for mobile, and do it yesterday
- 73% of mobile Internet users will switch out of a site if it’s poorly designed.
- 52% of mobile Internet users are less likely to engage with a company and brand if the mobile experience is bad.
- 80% of the top websites are optimized for mobile users.
Blogging Statistics and Facts
Blogging is one of the best ways you can draw in traffic to your website and business. Make sure you’re prepared to do it the right way with these facts and numbers:
People still love to read (and write) blogs
- More than seven million blog posts are published each day.
- There are 70 million blog posts published each month on WordPress (the most popular CMS out there).
- Speaking of WordPress, more than 409 million users read more than 20 billion pages of blog posts each month on the platform!
- There are more than 32.7 million bloggers in the US alone.
- 77% of people read blogs online.
- There are more than 600 million blogs in the world.
Blogs are still a great way to gain leads
- Brands that have blogs produce 67% more leads than those that don’t have blogs.
- 59% of B2B marketers believe that blogs are their most valuable marketing channel.
- 60% of users are inspired to purchase or seek out a product after they view content about it.
- 70% of people would rather learn about a brand or product through an article than a traditional advertisement.
- Content marketing (using content like blog posts to promote your brand and products) produces three times more leads than traditional advertising.
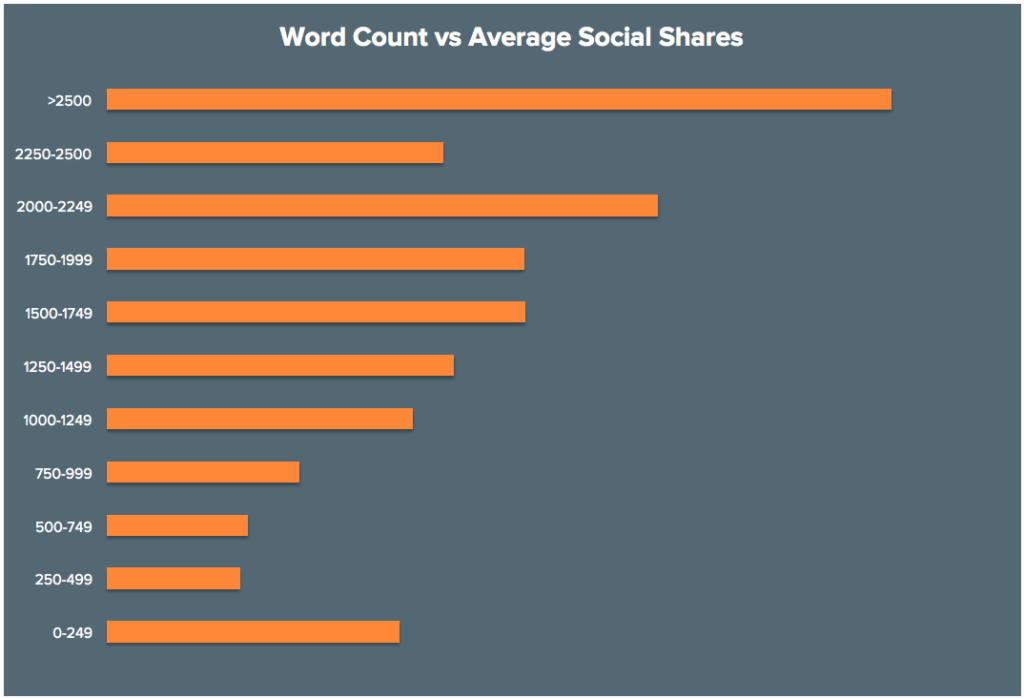
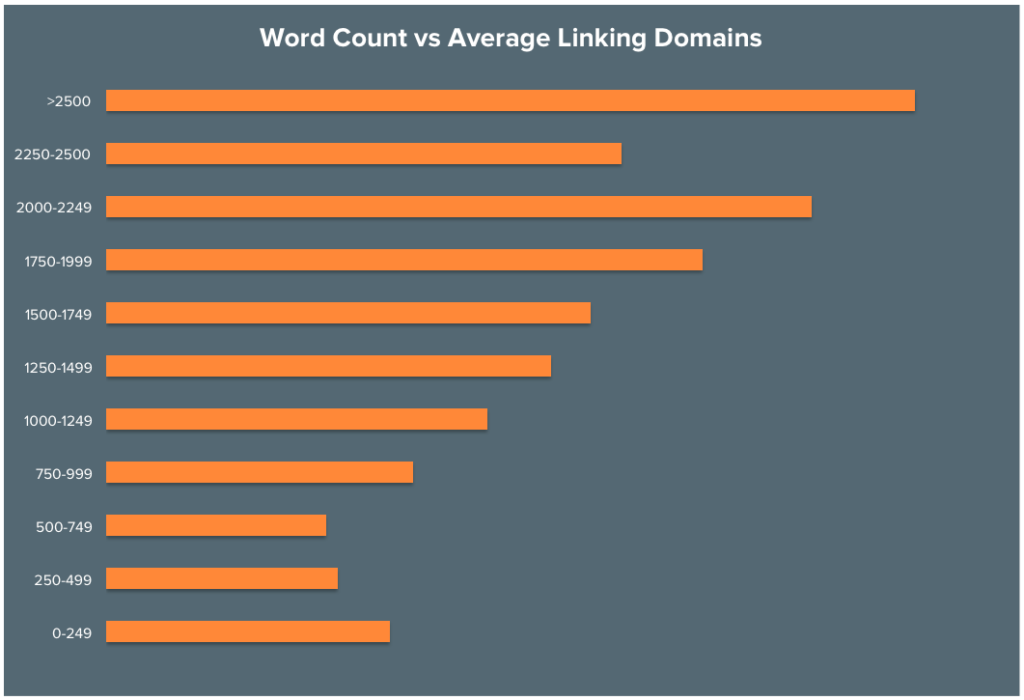
Aim for longer blog posts
- On average, articles and blog posts with 2,500 words tend to draw in more traffic than shorter articles.
- According to a study from BuzzSumo that looked at more than 100 million digital articles, longer articles also tend to get shared the most across all social media platforms.
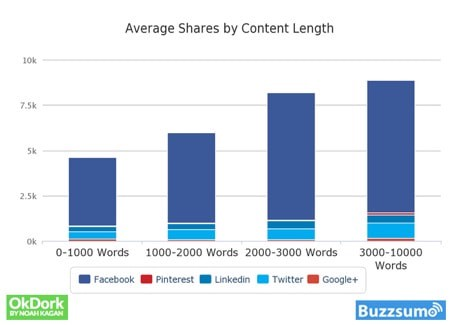
- HubSpot also did an analysis of nearly 6,200 articles and discovered that articles with more than 2,000 words typically got more backlinks (important for SEO) and social shares.
Ecommerce Statistics and Facts
To create (and maintain) a good ecommerce website, you’ll need to keep up with the trends and data that reflect your users’ purchasing decisions. Here are a few that might help:
Business is booming…online
- Global ecommerce sales have exceeded $5.7 trillion annually.
- US ecommerce sales will exceed $1.1 trillion in the US alone.
- The CAGR of ecommerce in India is 14.11%, which leads the world projections from 2023 to 2027.
It’s Amazon’s world and we’re all living in it
- Amazon controls roughly 38% of the total global ecommerce market share.
- During the most recent Amazon Prime Day, the company sold more than 375 million items worldwide.
- Amazon generated $127.36 billion in Q1 2023.
Optimize your ecommerce site—or die! (okay, that’s only a little dramatic)
- A single second delay on a web page in your ecommerce site might mean a 7% dip in conversions.
- One study found that a 2 second delay in load times increases shopping cart abandonment rate to 87%.
You’ll want to make sure your website looks good across different platforms too.
Here are the average value of online shopping orders by device:
- Desktop: $128.08
- Tablet: $96.88
- Mobile phone: $86.47
- Other: $80.06
Web Hosting and CMS Statistics and Facts
Your web host and CMS are the bedrock of your website and, therefore, your business. Here is the data to help you out:
There are a lot of websites, but most aren’t doing anything
- There are more than 1.8 billion websites online today. That number grows literally by the second.
- However, about 75% of all websites online aren’t actually doing anything. Rather, they’re parked domains.
- Total global revenue from web hosting is expected to clear roughly $124.8 million by the end of 2023.
WordPress is the most popular content management system (CMS) by far
- The most popular CMS is WordPress—and it’s not even close. It accounts for 63.6% of the total CMS marketplace.
- That’s more than literally all the other CMSs combined.
- Around 35% of the Internet leverages WordPress for their CMS.
- Big names use WordPress too such as The New York Times, The New Yorker, and even the U.S. State Department.
The United States dominates the web hosting industry
- The 3 most popular web hosting providers are GoDaddy, Cloudflare Hosting, and Google. All of them are US-based corporations.
- 40.5% of all websites are located in web hosts based in the United States. That’s around 107.62 million domains – much more than any other country in the world.
- The second country (Germany) doesn’t even come close with 7.9 million. They help host a mere 9.6% of the websites in the world.
Here are the top three languages used on the internet:
- English: 60.3%
- Russian: 8.6%
- Spanish: 4%
If you want to reach a wider audience then, you definitely need to make sure that your website includes an option to translate it into English.
Social Media Statistics and Facts
Social media is more popular and powerful than ever. Make sure that your brand knows the right moves to make with these facts and numbers:
Mostly everyone is on social media
- Of the world’s population of 7 billion, 3.8 billion of them are on social media. That’s a little over half of the entire world’s population.
- Central America and Eastern Asia boast the highest social media penetration rates with 84% each.
- Northern America sits at 82% of active social media use.
Here’s the breakdown of social media usage in the United States by age:
- 90% of adults age 18-29 use at least one social media site
- 82% of adults age 30-49 use at least one social media site
- 69% of adults age 50-64 use at least one social media site
- 40% of adults age 65 or older use at least one social media site
- When it comes to gender (Pew conducted it by binary), women tend to use at least one social media site more than men with 78% of U.S. women on the site compared to 65% of U.S. men.
Here is a breakdown of social media use by income:
- 78% of U.S. adults who use at least one social media site make $75,000+ a year
- 83% of U.S. adults who use at least one social media site make $50,000-$74,999 a year
- 70% of U.S. adults who use at least one social media site make $30,000-$49,999 a year
- 68% of U.S. adults who use at least one social media site make less than $30,000 a year
- 73% of all U.S. adults use YouTube, while 69% of all U.S. adults use Facebook.
- The next one is Instagram which sees just 34% of U.S. adults using it.
We spend a TON of time on social media
- Users typically spend 2 hours and 24 minutes of every day on social media sites. That’s nearly half of our entire time on the Internet.
- Younger people spend more time on social media with people 16-24 spending an average of 3 hours on social media.
- The average user has up to 8.3 social media accounts across different platforms.
- Predictably, that number jumps when you get to people at 16-24 with 9.4 social media accounts.
It’s Facebook’s world and we’re all living in it.
- Facebook is the most popular social media platform in the world by far with 3 billion.
- YouTube comes in second with 2.7 billion.
- Instagram boasts “only” 2.3 billion users.
- If you’re a B2B company, though, it’s no question that you should be on LinkedIn. In fact, 97% of B2B marketers leverage the site for content marketing.
- This is all despite the fact that LinkedIn has a user base of 590 million.
- However, Facebook is responsible for a big 60% of all ecommerce referrals. That means if you’re running an online store, you definitely want to make sure your Facebook game is strong.
SEO Statistics and Facts
Search engine optimization (SEO) is a fantastic way to build an organic traffic engine and increase your brand’s awareness. Here are a few numbers and facts to keep in mind when you’re doing so:
It’s Google’s world and we’re all living in it.
- Google continues to be the number one search engine in the entire world, with 93% market share.
- The next most popular search engine is Bing which only receives around 2.77% of total market share.
- There are more than 8.5 billion Google searches per day, globally.
- According to Google, they index hundreds of billions of webpages and is more than 100,000,000 gigabytes in size. Crazy!
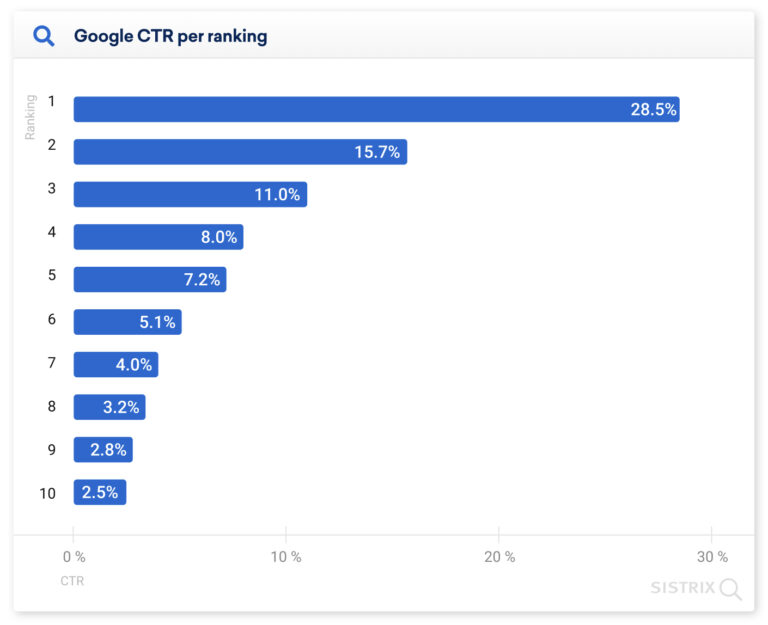
If you’re not first (page), you’re last.
- 75% of search engine users don’t go past the first page. That means if your article ranks beyond the first page, you’re likely not going to benefit from your SEO efforts.
- An average of 28.5% of users click on the first result of a Google search.
- That number drops off dramatically as you go down the page, with the second result receiving only 15.7% and the last result receiving just 2.5%.
- The average word count for an article on the first page of Google is 1,447 words.
- The average #1 result on Google averages 3.8x more backlinks than any other position.
Domains Statistics and Facts
A good domain name is memorable and reflective of your brand. Domains are also a booming industry you can take advantage of. Here are the numbers and facts you should know to get started:
All the good domains are taken–but people still register domains by the millions.
- The first domain name ever registered was Symbolics.com—a now defunct computer manufacturer based in Massachusetts that registered the domain on March 15, 1985.
- Since then, the number of registered domain names have exploded. In fact, there are more than 351.5 million domains registered.
- This means if you’re looking for .com domain names using common words and phrases, you’re going to be out of luck. They’re likely already taken!
Domain names can go for a lot of money
- About 1/3 or these .com domain names are unused. They are likely owned by someone who wants to sell them to prospective buyers.
- The highest-selling domain name recorded was Cars.com, which sold for an eye-popping $872 million.
- Sales of domain names is a booming industry. It currently has a market size of $6 billion.
- The top domain registrar is GoDaddy, which controls about 24% of the market share.
- Behind GoDaddy in second place is NameCheap, which controls just 8% of the market share.
Conclusion
There you have it! More than 100 website statistics and facts to help guide your decision making process this year.
With all this said, it’s important to remember a crucial tenet: The map is not the territory.
That means that, as helpful as these numbers and pieces of data are, it’s not going to give you a full picture and understanding of reality. It’s also not going to give you a good idea of what is necessarily best for your brand and business.
To understand those details, well…you’re just going to have to do the work and dig into the numbers yourself. No matter what though, we’ll be here to help you out every step of the way.