Bounce rate has never been a good North Star metric.
And in 2026, it’s even less useful.
But first, what is bounce rate?
Bounce rate is the percentage of sessions where people leave without meaningfully engaging. They load a page and exit before doing anything that signals real interaction.
In theory, it was supposed to reveal what content attracts people and what pushes them away. In practice, it doesn’t do either reliably.
The New Definition of Bounce Rate in Google Analytics 4
In Google Analytics 4, a session counts as a bounce if it is not an engaged session. A session is not engaged only when all of the following are true:
- The visitor spends less than 10 seconds on the site
- No second page (or screen) is viewed
- No key event (formerly called a “conversion” in GA4) is triggered
If that feels like a ridiculously low bar for “engagement,” that’s because it is. It’s common for a large chunk of users to miss that 10-second threshold—people scan fast and move on.
Bounce rate in GA4 is tied to a companion metric called engagement rate.
Engagement rate is the inverse of bounce rate—it’s the percentage of sessions that meet at least one of these:
- Session lasts 10 seconds or longer
- A second page (or screen) is viewed
- At least one key event fires
In other words, bounce rate and engagement rate always add up to 100%.
That also means there’s no reason to look at both. If you insist on using one, pick a single metric—because they tell you the same thing.
The Old Definition of Bounce Rate in Universal Analytics
For years, a session was a “bounce” in Universal Analytics if it had only one interaction hit—no second pageview and no event—before the session ended.
This was the legacy definition in Universal Analytics and earlier. It’s how the metric worked when many of us first started with Analytics over a decade ago.
Example: a new visitor opens a blog post, reads for five minutes, and closes the tab without clicking anything else. That was still a bounce because there was only one hit.
During that era, most practitioners treated bounce rate as noise. People don’t browse for fun; they come with a question, want the answer, and then leave. Only a minority will click around.
Note: Universal Analytics was fully sunset—properties stopped processing data in 2023, and Google removed access to most historical UA data in 2024. The example below reflects how UA worked historically.
I just grabbed this Universal Analytics report from one of my sites:
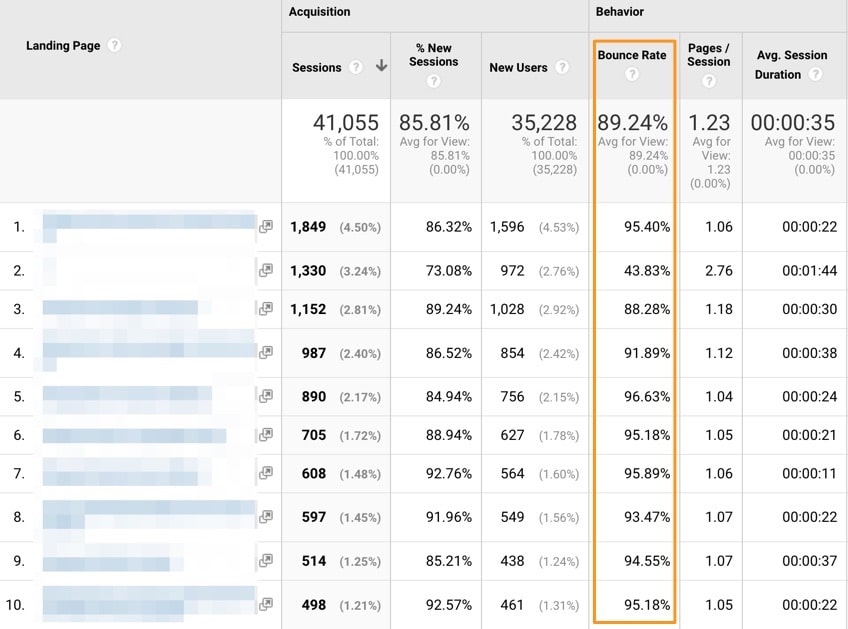
It’s a blog, and nearly every page shows bounce rates above 90%. The homepage is lower, which makes sense—many people use it to navigate to other pages.
Can I act on this? Not really.
In Universal Analytics, bounce rate was largely useless. Across sites doing hundreds of thousands or millions of monthly visits, I can’t recall a time it provided an actionable insight. Most pros ignored it.
This was an open secret. Google heard the feedback and tried to modernize the concept in GA4. Hence the changes.
Did Google Analytics 4 Make Bounce Rate Useful?
Nope.
Universal Analytics produced bounce rates that were inflated. GA4 often produces bounce rates that look “healthier” but still mislead.
First, small sites. Here’s real data from a smaller property I work on:
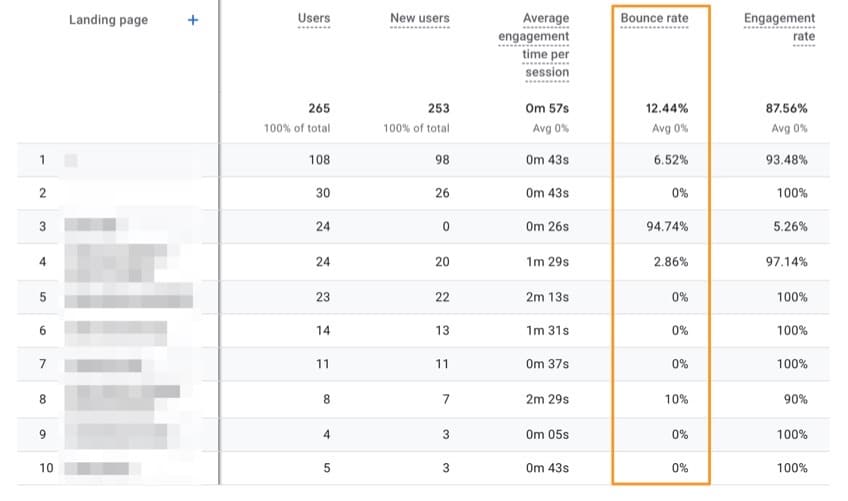
Bounce rates are zero or near-zero on pages that get traffic. The few high outliers are often tracking issues.
Now larger sites. Small-sample weirdness fades once volume is high. Here’s a property with 100,000+ sessions/month:
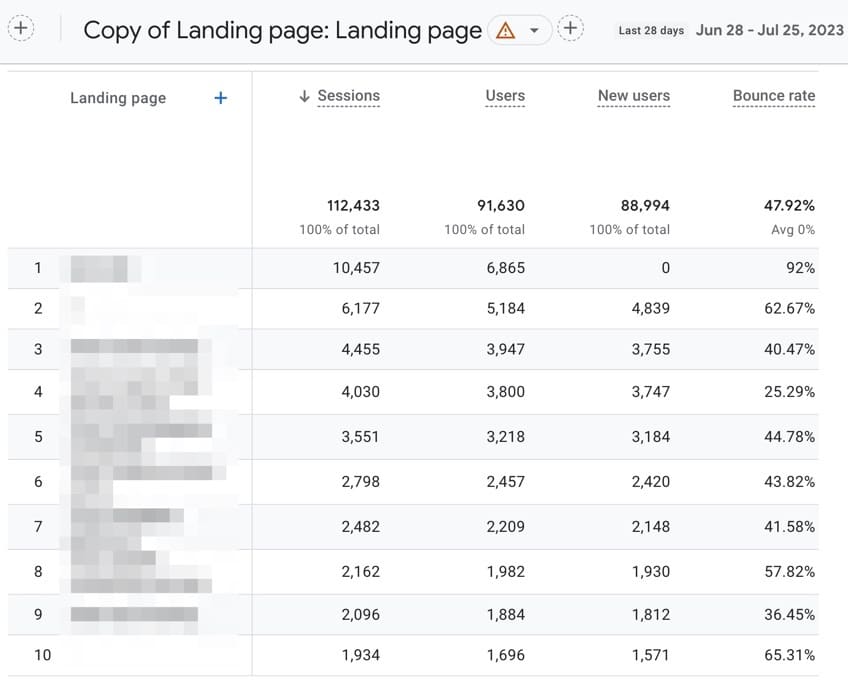
Now the numbers feel “real.” Across multiple large sites, most pages sit between 30–60% bounce in GA4.
Compared to the old metric, this is still worse—just in a different way.
Why?
Because bounce rate doesn’t measure satisfaction. The modern web teaches people to find answers fast: click, scroll, scroll, got it, close.
I play a lot of games and constantly look up builds, drops, and boss stats. I routinely spend under 10 seconds on a page even when it gives me exactly what I need.
Remember: bounce rate doesn’t tell you what happens after your page. Did the visitor leave unhappy, or did they get the answer and move on with their day? You can’t tell.
So a post with a 60% bounce rate might be doing a fantastic job.
If the answer is right at the top, people will load, get it, and leave. That’s a win for the user. Over time, pages that satisfy intent quickly tend to earn better engagement and visibility.
Your bounce rate can look awful while your content is excellent.
That makes bounce rate a poor place to spend your time. Focus on metrics that give clear answers and tie to outcomes.
What’s a Good Bounce Rate?
If the metric is broadly unhelpful, “good” doesn’t matter.
In GA4, most pages land between 30–60% bounce. Higher numbers aren’t automatically “bad,” but they can hint at problems worth checking: broken links, aggressive interstitials, tracking bugs, mismatched titles/descriptions, or painfully slow loads.
Otherwise, I don’t compare bounce rates or try to optimize them.
How to Get Bounce Rate in Google Analytics 4
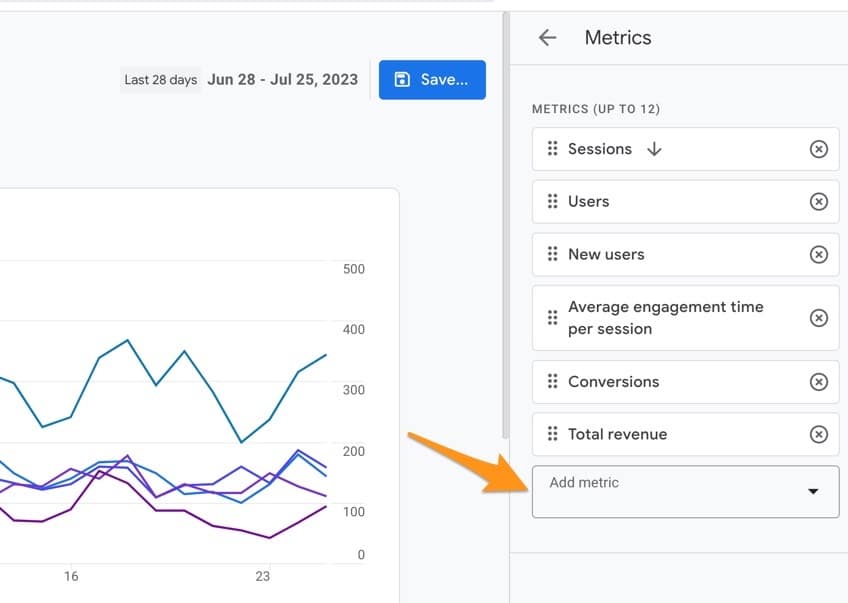
Bounce rate isn’t shown by default in GA4. To surface it, open a standard report and customize it. In the report customization panel, click Metrics:
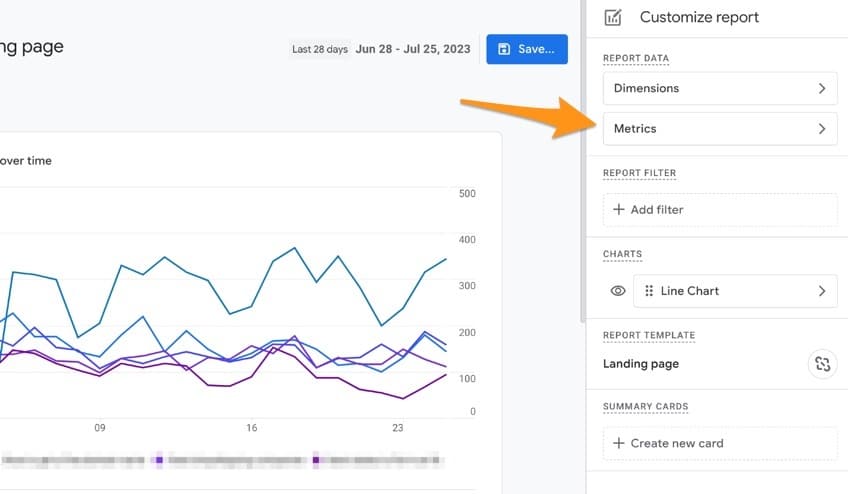
You’ll see the list of metrics included in that report. Click Add metric:
Search for Bounce rate, select it, and save. Reorder metrics however you prefer.
When you’re done, the report will display bounce rate like this:
Yes, GA4 hides it a bit—and that’s fine. Bounce rate doesn’t tell you much. But if you want it, that’s where it lives.
How to Improve Bounce Rate
First: don’t “improve” bounce rate. If you make your content faster and clearer, your bounce rate will often look worse.
I’m serious.
Better pages answer questions faster. Fast answers = more quick exits.
Take site speed. Common advice says faster sites keep people longer. Not necessarily.
Speeding up your site helps people find what they need—so more of them bounce sooner. That’s success.
And that’s a good thing.
If your global bounce rate “improves,” I start to worry you might’ve made the experience worse. There are plenty of ways to force time-on-page without helping the reader:
- Inflated tables of contents that require extra scrolling
- Popups or interstitials with tiny close buttons
- Intentional slowdowns that create artificial dwell time
- Mid-content ad blocks that repeatedly interrupt reading
- Long, irrelevant intros (the classic recipe blog life story)
I could keep going.
All of these can lower bounce rate—and harm rankings, revenue, and user trust.
If your boss tells you to “fix bounce rate,” explain that it’s not an outcome metric. Then point to the metrics that actually matter.
Metrics to Use Instead of Bounce Rate
Use outcome-tied, intent-aware measurements that reflect real progress:
- Engagement rate & engaged sessions: Directional health of sessions that actually interact.
- Average engagement time per session: Time spent actively viewing, not just sitting on a tab.
- Scroll depth & first meaningful interaction: How quickly people find and use key elements.
- Conversion rate & micro-conversions: CTA clicks, signups, adds to cart, tool usage—whatever “success” is for the page.
- SERP click-through rate: Is your title/description earning the click for the query intent?
- Return visitor rate & content retention: Do people come back for more?
- Core Web Vitals: LCP, INP, CLS—speed and stability that users actually feel.
- Event funnels: Steps completed on the path to the outcome (e.g., view > compare > add to cart > checkout).
- On-page feedback: Quick “Was this helpful?” polls or satisfaction micro-surveys.
A Practical Checklist to Improve Real Outcomes
Instead of chasing bounce, ship improvements that help readers finish their task fast:
- Answer first. Put the conclusion, TL;DR, or key steps above the fold with clear subheads.
- Match intent. Align each page with a single search intent; split mixed-intent topics into separate pages.
- Sharpen titles & descriptions. Promise exactly what the page delivers—then deliver it immediately.
- Speed matters. Optimize LCP/INP/CLS. Faster pages convert better even if bounce looks “worse.”
- Make CTAs obvious. Clear, specific, low-friction actions (try, demo, price, download, contact).
- Structure for scanning. Short paragraphs, descriptive H2/H3s, bullets, and useful tables—not fluff.
- Cut dark patterns. No intrusive popups, bait-and-switch CTAs, or “infinite” interstitials.
- Measure what matters. Define key events (conversions) and micro-conversions; build event funnels in GA4.
- Close loops. Add related resources and smart internal links for next steps when the user wants them.