Want to jump straight to the answer? The best network monitoring software and tool for most people is Auvik or PRTG Network Monitor.
Network monitoring is one of the most important components of a robust IT infrastructure.
As the name implies, network monitoring tools oversee network components like servers, routers, firewalls, switches, and more. They help organizations track performance like uptime and downtime while alerting admins if there’s a problem.
The Top 11 Best Network Monitoring Tools and Software
- Auvik – Best For Proactively Identifying Network Risks
- PRTG Network Monitor – Best All-in-One Network Monitoring Tool
- Datadog – Best For Cloud Service Monitoring
- LogicMonitor – Best For IT Infrastructure Monitoring
- ManageEngine OpManager – Best For Real-Time Server Monitoring
- Idera Uptime Infrastructure Monitor – Best For Network Device Monitoring
- WhatsUp Gold – Best Network Analytics and Performance Reports
- Solarwinds Network Performance Monitor – Best For Advanced Users
- Zabbix – Best Open Source Network Monitoring Software
- Connectwise Automate – Best For Custom Network Monitoring
- Atera – Best For Remote Network Monitoring
With new software, tools, and technology being launched on a daily basis, you need to find a network monitoring solution that can keep up with the ever-changing marketplace. These in-depth reviews contain the features, benefits, pricing, and potential use cases for each tool on our list.
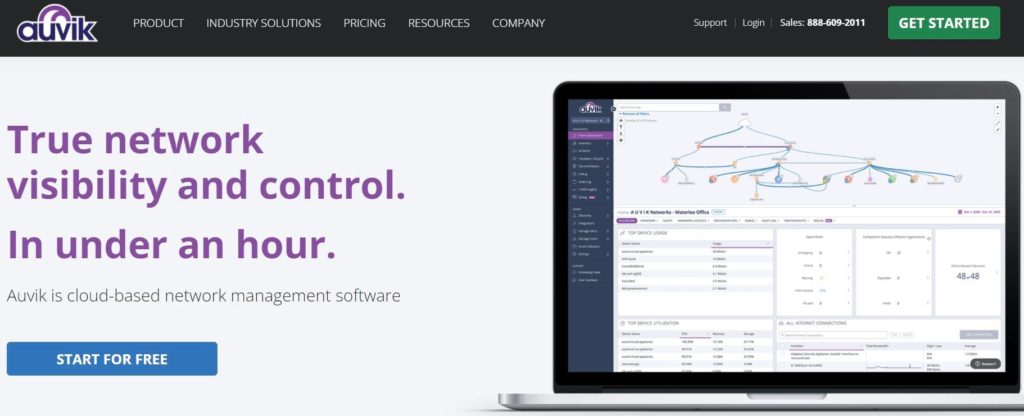
Auvik – Best For Proactively Identifying Network Risks
Auvik is a cloud-based network management software that helps prevent bottlenecks in any system, gives you real-time notifications of potential issues and errors with in-depth descriptions, and automates many network security tasks.
Auvik has a traffic analysis tool that looks for anomalies on your network and dynamic network maps show you exactly where all IT assets are located, who is on the network, what apps are being used, and where traffic is going. These network maps are updated in real-time and the detail is fantastic.
In line with Auvik’s commitment to simplicity and performance, many things are automated, including:
- Network monitoring and alerting
- Security and performance updates
- Network and port discovery, mapping, and inventory
- The collector that gathers topology, configurations, and network statistics through encrypted connections
- Real-time alerting
- Configuration backups
In addition to Auvik’s built-in tools and features, users can integrate with other popular ticketing, documentation, and dashboard tools and APIs. A few integrations include ArcusTeam, Datto, CloudRadial, Connectwise, Freshdesk, Globaldash, ITGlue, Microsoft Teams, Slack, and others.
Get started today with a 14-day free trial of Auvik or get a customized quote for your needs.
PRTG Network Monitor — Best All-in-One Network Monitoring Tool
PRTG Network Monitor is a top recommendation in this category. It’s an all-in-one networking monitoring solution for your entire IT infrastructure.
The software monitors all of the devices, traffic, systems, and applications that run on your IT operation. PRTG Network Monitor comes with everything you need out of the box, so you won’t need additional installations or plugins to get the most out of this tool.
PRTG is robust and easy-to-use, which can accommodate the needs of all business sizes.
More than 300,000 users across the globe use PRTG for network monitoring. The tool helps you manage and monitor components like:
- Bandwidth
- Databases
- Applications
- Cloud computing services
- SNMP
- Servers
- LAN
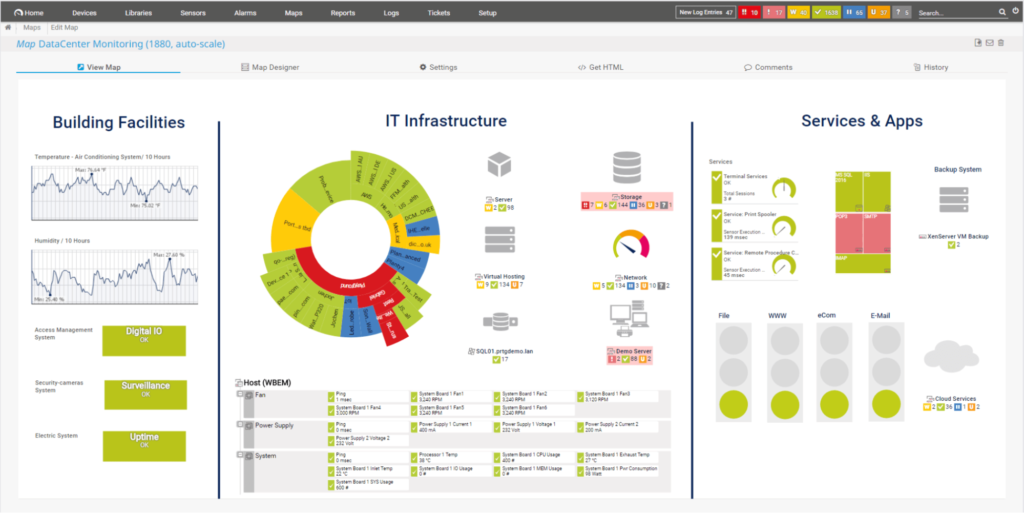
PRTG will alert you when problems or usual metrics are discovered. View your network performance at a glance with visual dashboards and maps.
Pricing for PRTG is based on sensors, which is the number of aspects that you can monitor on each device. There’s a free plan for up to 100 sensors.
Perpetual licenses start at $1,750 for 500 sensors and go all the way up to $15,500 for unlimited sensors. Try PRTG’s unlimited version free for 30 days.
Datadog — Best For Cloud Service Monitoring
Datadog is a cloud monitoring tool. It’s used by thousands of organizations, including well-known brands like Samsung, Whole Foods, and Peloton.
The software is branded a “modern monitoring and security” solution. With so many organizations relying on the cloud to operate, Datadog has been growing in popularity.
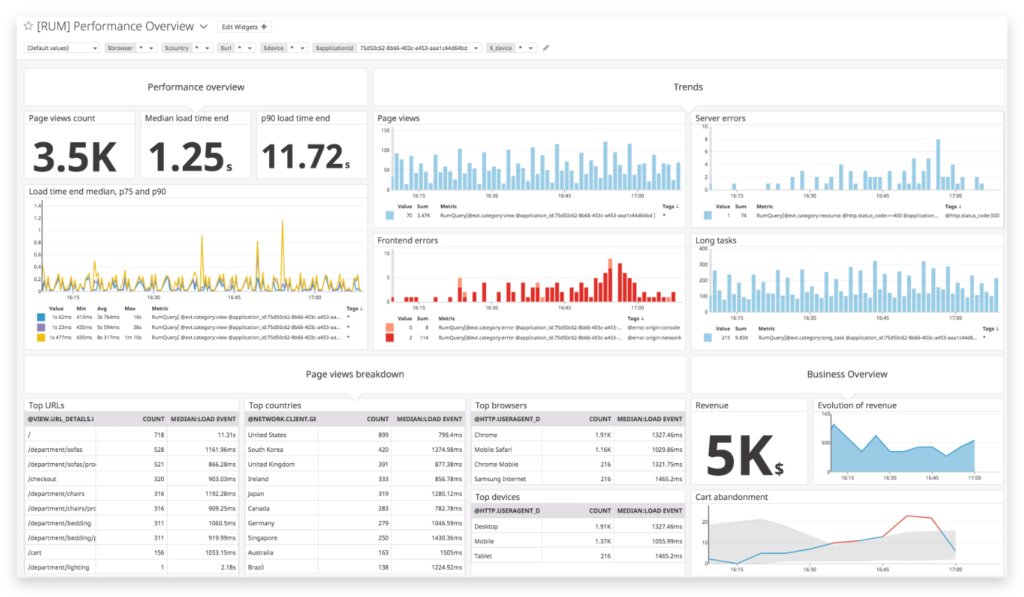
Gain valuable insights across apps, systems, and services. Datadog is great for bug tracking and SaaS providers. The tool makes it easy for you to monitor user experience on a single platform.
It’s easy to use and has 400+ integrations that you can deploy in minutes. View frontend metrics, backend metrics, visualize load times, and filter traffic by source or destination.
Datadog has two infrastructure monitoring plans— Pro and Enterprise. These start at $15 and $23 per host, respectively.
Starting rates for additional plans include:
- Serverless — $5 per function per month
- Log Management — $1.27 per million log events per month
- APM — $31 per host per month
- Security Monitoring — $0.20 per GB of analyzed logs per month
- Network Performance — $5 per host per month
LogicMonitor — Best For IT Infrastructure Monitoring
LogicMonitor is a fully automated infrastructure monitoring tool for managed service providers and enterprise IT departments. As a cloud-based software, LogicMonitor makes it easy for you to monitor full-stack visibility of your networks, servers, cloud, and more within a single platform.
One of the reasons why LogicMonitor ranks so high on our list is because it’s lightweight and easy to scale.
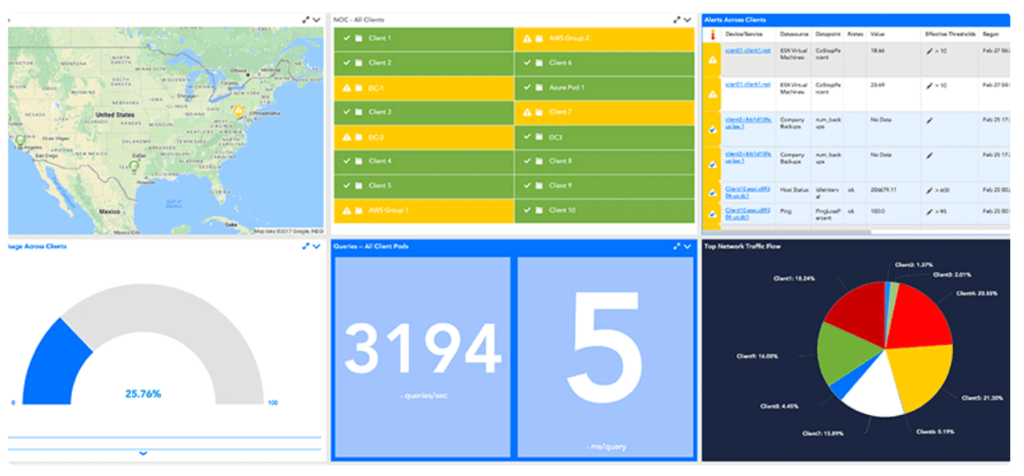
LogicMonitor has 2,000+ pre-configured integrations out of the box. Some of the other top features and benefits of LogicMonitor include:
- Cloud monitoring
- Storage monitoring
- Dynamic services monitoring
- Network monitoring
- Server monitoring
- Container monitoring
- Configuration monitoring
There are three LogicMonitor plans for you to choose from. There’s a Pro and Enterprise version for Hybrid Infrastructure Performance monitoring. Those plans accommodate up to 199 and 200+ devices, respectively. LogicMonitor also has a website monitoring plan for up to 199 devices.
To learn more about pricing, request a free quote from the LogicMonitor sales team.
ManageEngine OpManager — Best For Real-Time Server Monitoring
ManageEngine OpManager gives you end-to-end visibility of your network infrastructure. The software provides analytics for things like wireless networks, local devices, and even non-computing devices (such as access points and printers).
The software has integrated troubleshooting functionality with planning and configuration management tools.
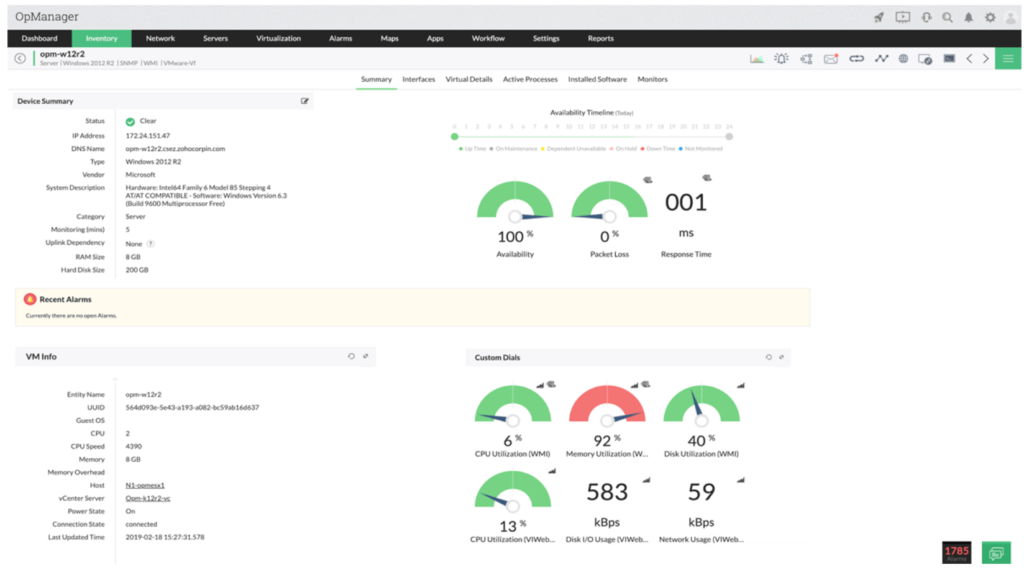
Top features of ManageEngine OpManager include:
- Real-time network monitoring
- Physical and virtual server monitoring
- WAN link monitoring
- Multi-level thresholds
- Customizable dashboards
The software is affordable and easy to deploy. ManageEngine OpManager has over 2,000 built-in network performance monitors. The ability to monitor both visual and virtual servers as well as the performance of the server hosts is definitely the platform’s standout feature.
To get started, request a quote online.
Idera Uptime Infrastructure Monitor — Best For Network Device Monitoring
Idera Uptime Infrastructure Monitor is a highly flexible network monitoring tool. It has the ability to monitor anything. The software supports server monitoring across Windows, Linux, Solaris, Novell, UNIX, and more.
With the Idera Uptime Infrastructure Monitor, you can oversee thousands of devices on your network. Anything with an IP address can be monitored with this solution.
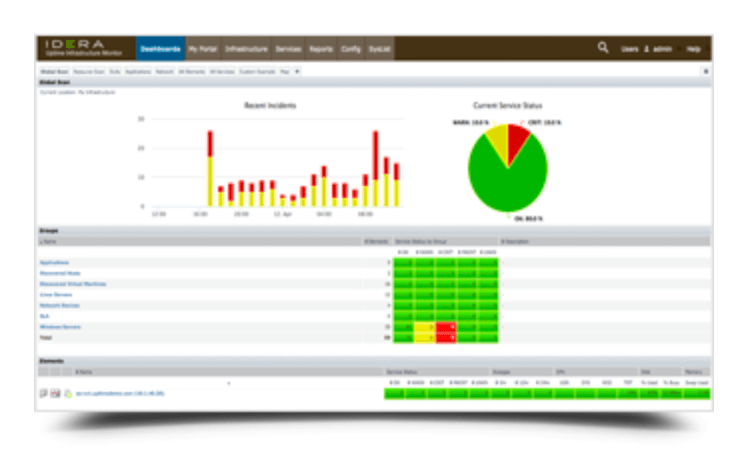
The software allows you to handle a wide range of functions, such as:
- Plan for server capacity requirements
- Track service-level trends for SLA reporting and compliance
- Simplify incident management
- Monitor network devices and servers
- Monitor VMs and applications
You can manage all of these things from a single dashboard with the Idera Uptime Infrastructure Monitor. Try it free for 30 days; no credit card required.
WhatsUp Gold — Best Network Analytics and Performance Reports
WhatsUp Gold by Progress (formally Ipswitch) is a simple tool for viewing uptime, downtime, and performance at a glance.
But don’t let the simplicity of the dashboard fool you. The software is robust and gives you complete visibility of the status for network devices, applications, and systems.
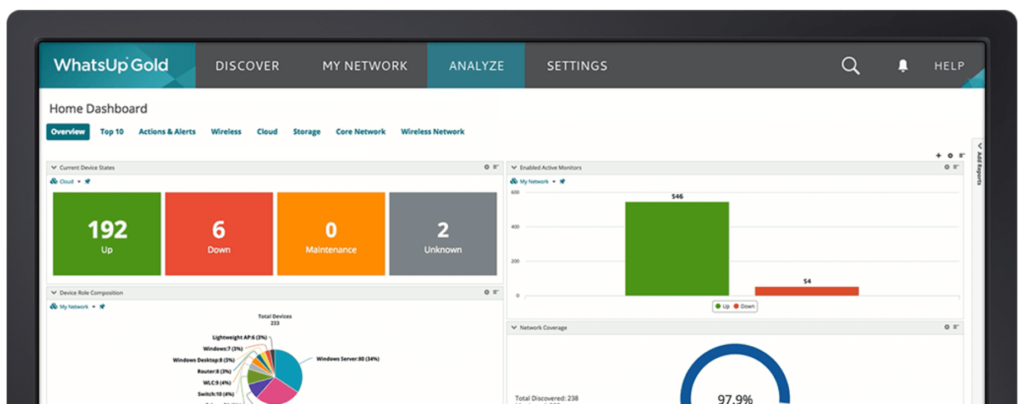
WhatsUp Gold integrates with everything. It has a REST API, so your IT team can integrate the software with your own system. With the WhatsUpGold iOS and Android apps, you can view the status of your network from anywhere.
Other capabilities include:
- Discovery and network mapping
- Real-time reporting
- Custom dashboards
- Network monitoring and alerts
- Cloud monitoring
Download the WhatsUp Gold free trial to get started or request a quote.
Solarwinds Network Performance Monitor — Best For Advanced Users
The Solarwinds Network Performance Monitor is a multi-vendor network monitoring tool. It has the capacity to expand and scale with the ever-changing needs of your network.
Are VPN tunnels up or down? Is your app having problems, or is the network to blame? Solarwinds can help you answer these questions. You’ll also be able to monitor on-premises, private clouds, and public cloud networks from a single source of truth.
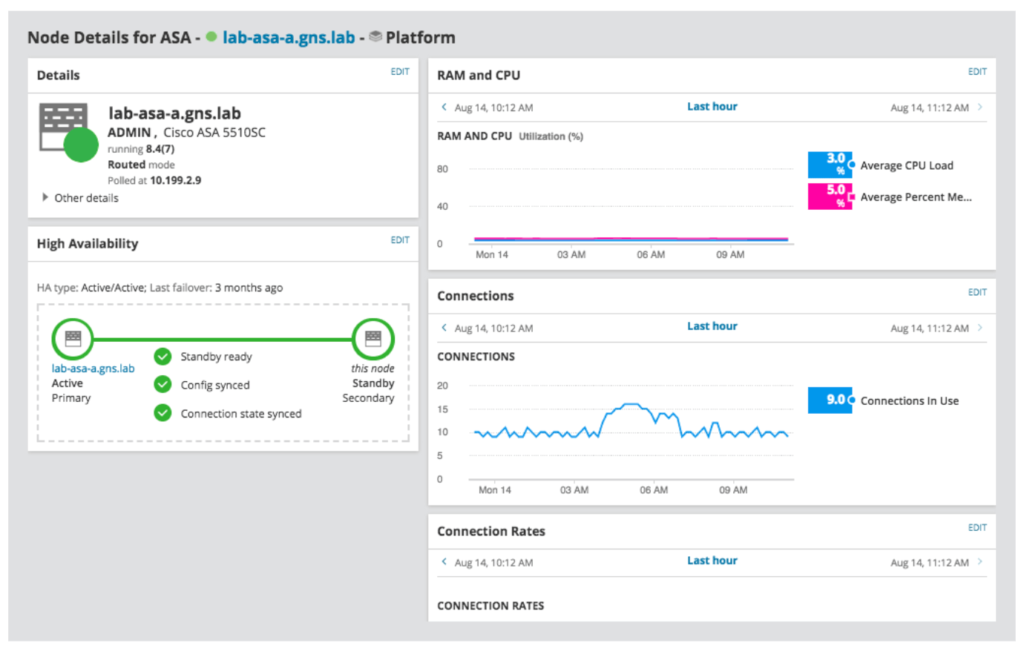
Top features of the Solarwinds Network Performance Monitor include:
- Wifi heatmaps
- Network analysis tools
- LAN monitoring
- Network device scanning
- Network device discovery
- Network diagnostic tools
- Network performance testing
- Wifi network analysis
- SNMP scanner and monitoring
- Cisco ASA monitoring
- Deep packet inspection
Overall, the software isn’t quite as easy to use as some of the other solutions on our list. It’s better for people who have used network monitoring tools in the past.
Pricing starts at $1,785. Contact Solarwinds to request a quote or learn more about subscriptions and perpetual licensing options. You can try the Solarwinds Network Performance monitor free for 30 days.
Zabbix — Best Open Source Network Monitoring Software
Zabbix is an enterprise-grade network and application monitoring tool. It’s 100% free and open source.
The tool has been around for more than 20 years and has 300,000+ installations across the globe. It’s trusted by big names like Dell, Salesforce, and ICANN.
We like Zabbix because it’s highly flexible. You can use it for any type of IT infrastructure.
- Server monitoring
- Cloud monitoring
- Application monitoring
- Network monitoring
- Web monitoring
- Database monitoring
- Storage device monitoring
- Java application monitoring
- KPI/SLA monitoring
- Virtual machine monitoring
Zabbix has solutions for a wide range of industries, including banking and finance, education, marketing, IT and telecommunications, energy, retail, aerospace, government, and more.
Download Zabbix now to get started for free in less than 10 minutes.
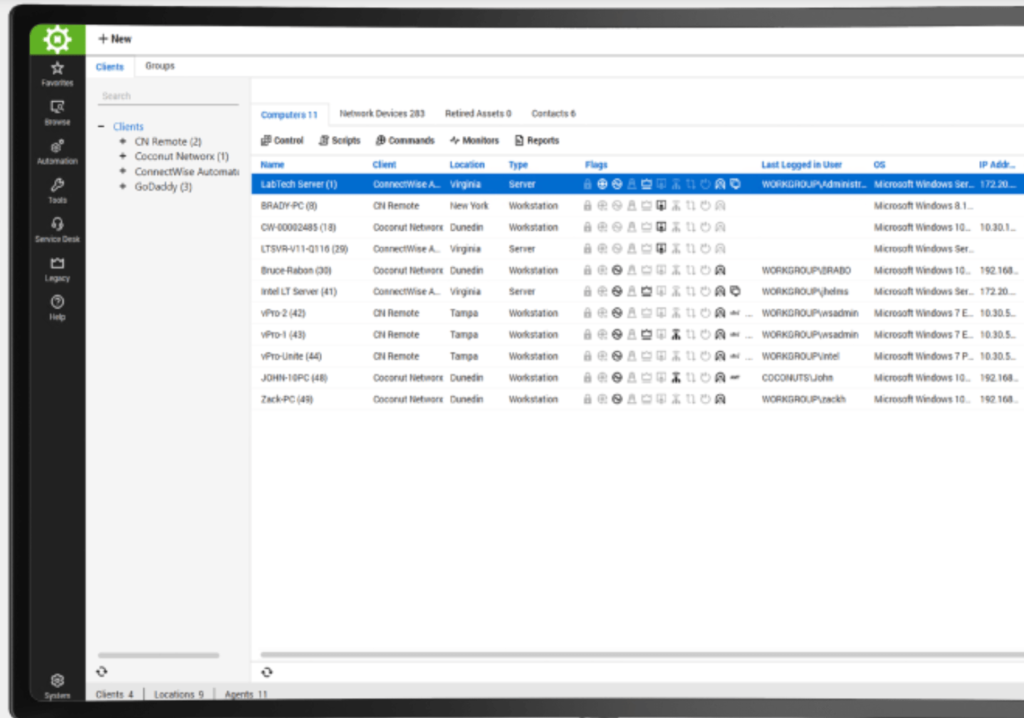
ConnectWise Automate — Best For Custom Network Monitoring
As the name implies, ConnectWise Automate is a network monitoring solution that leverages automation. It’s a robust and feature-rich remote monitoring and management (RMM) solution.
Connectwise Automate is perfect for those of you who want to be proactive with your network monitoring. The software helps prevent crashes and other issues, which ultimately saves time and money in the long run.
Top features and benefits of ConnectWise Automate include:
- Patching
- Proactive monitoring
- Asset discovery
- Endpoint management
ConnectWise Automate is customized to accommodate your unique needs. You can request a personalized quote online and start your 7-day free trial.
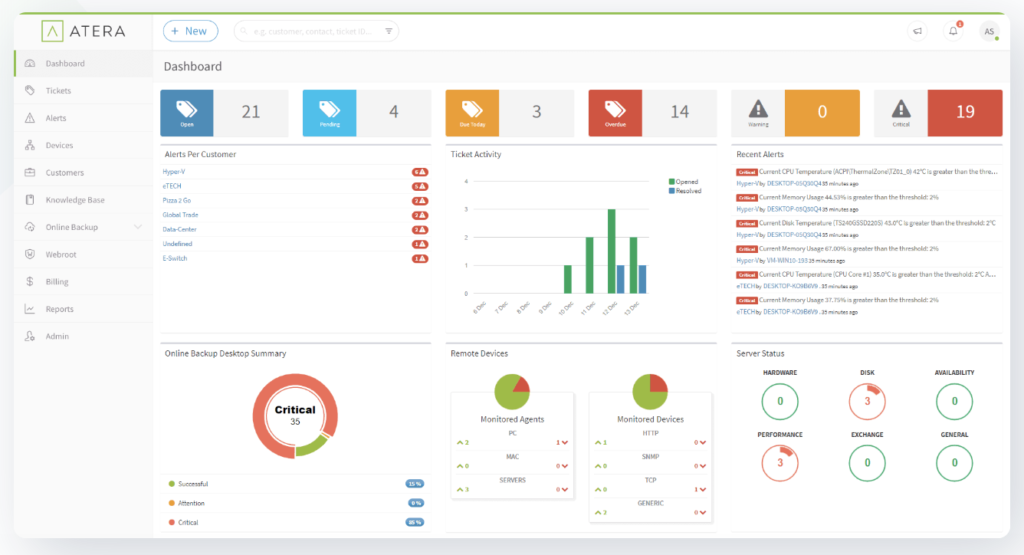
Atera — Best For Remote Network Monitoring
Atera is another RMM (remote monitoring and management) software. It has everything that managed service providers (MSPs) need to provide excellent customer service.
The software comes with built-in tools for things like ticketing and customer satisfaction surveys, in addition to remote monitoring and management.
With Atera, MSPs will benefit from features like:
- Real-time alerts
- Contract and SLA management
- Network discovery
- Remote access and support
- Custom scripting
- Patch management
The software also integrates with tools like QuickBooks, Xero, and Freshbooks, so you can manage billing and invoicing from a single solution.
There are three Atera plans for you to choose from:
- Pro — $149 per technician per month
- Expert — $169 per technician per month
- Master — $199 per technician per month
All plans come with unlimited devices and agents. There are no installation fees, onboarding costs, or hidden charges. Try Atera free for 30 days.
How to Find the Best Network Monitoring Tools and Software For You
Finding the best network monitoring solution for your unique needs can be challenging if you don’t know what to look for. All of these tools are not created equally—and some have ultra-specific use cases.
This is the methodology that we used to pick the winners on our list. You can use these factors as well to evaluate and narrow down prospective options.
Custom Dashboards
Every business has different priorities for network monitoring.
On the administrative side of the software, you want to make sure that you can customize your views. Visual tools and on-screen graphics make it much easier to monitor performance at a glance.
You’ll find that the ability to make slight adjustments to these dashboards based on your preferences will be extremely helpful.
Automation
Automation is crucial for managing a large number of devices on your network. Your process becomes much more efficient if you can monitor as many tasks as possible.
For example, automated alerting is key. It’s much better to get an alert about an issue, downtime, or potential problem, as opposed to waiting until someone manually views the dashboards or reports.
Monitoring Needs
What exactly are you monitoring on your network?
Not every solution will be able to accommodate your needs. Some tools are better for physical and virtual server monitoring. Other tools are better for application monitoring and LAN monitoring. There are certain systems that can monitor anything with an IP address on your network, including non-computing devices.
In addition to the types of components you’ll be monitoring, you’ll need to think about the quantity as well. Some solutions are better for lower quantities, while others are built to scale.
Remote Monitoring
Managed service providers (MSPs) should lean towards a remote monitoring and management solution. RMM software has the monitoring capabilities you’ll need to manage clients remotely and provide high-quality customer service to those clients.
Organizations that are seeking a network monitoring solution for in-house IT infrastructure won’t have these same needs.